College Tuition Analysis
A tuition comparison was performed for all public and private 4-year accredited colleges and universities in the state of Iowa. Tuition rate increases between the 2005/2006 and 2006/2007 school years were also examined.
Calculations performed on the tuition data included calculating the 5-number summaries, means, and standard deviations with the information found. Boxplots, stemplots, and histograms were also used to graphically showcase the data.
Several schools had to be omitted from this analysis. In some cases, tuition data was unknown for the 2006/2007 school year. In other cases, namely with Loras College and Maharishi University of Management, tuition rates decreased, and thus were not included in analysis.
Rate Increases for all Iowa Schools
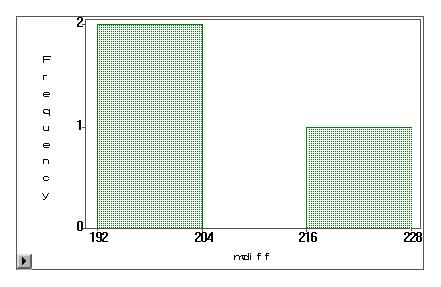
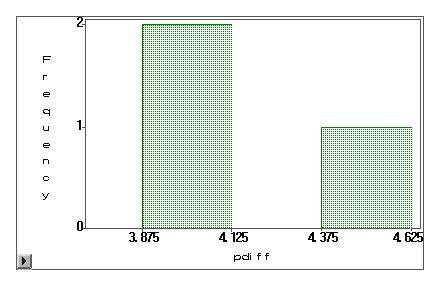
Public Schools
2005/2006 Tuition Data:
Mean: 4890
Standard Deviation: 0
No 5-number summary since all data is the same
2006/2007 Tuition Data:
Mean: $5094
Standard Deviation: 13.8564
Max: $5110
3rd Quartile: $5110
Median: $5086
1st Quartile: $5086
Min: $5086
Stem Leaf
511 0
510
510
509
509
508 66
----+----+----+----+
Multiply Stem.Leaf by 10**+1
Boxplot
+-----+
| |
| |
| |
| + |
*-----*
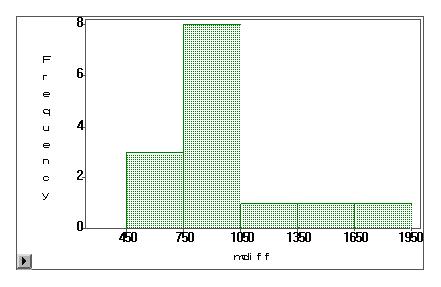
$ Difference in Tuition
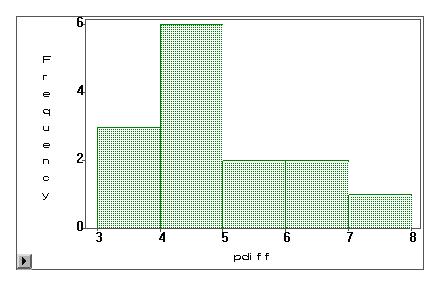
% Difference in Tuition
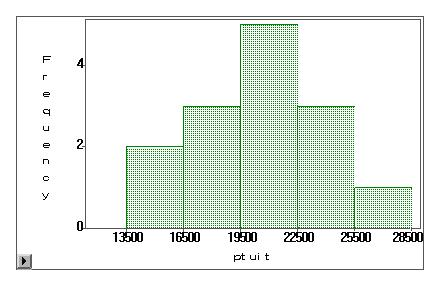
Private Schools
2005/2006 Tuition Data:
Mean: $20675.64
Standard Deviation: 351
Max: $27504.00
3rd Quartile: $23680.00
Median: $20911.00
1st Quartile: $17985.00
Min: $14964.00
Stem Leaf
26 5
24 6
22 79
20 7157
18 069
16 13
14 0
----+----+----+----+
Multiply Stem.Leaf by 10**+3
Boxplot
|
|
+-----+
*--+--*
+-----+
|
|
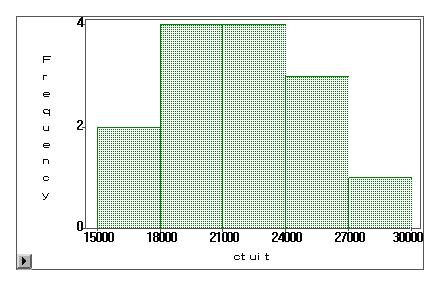
2006/2007 Tuition Data:
Mean: $21656.29
Standard Deviation: 377
Max: $29030.00
3rd Quartile: $24620.00
Median: $21957.50
1st Quartile: $18714.00
Min: $15575.00
Stem Leaf
28 0
26 4
24 68
22 036
20 09
18 375
16 6
14 6
----+----+----+----+
Multiply Stem.Leaf by 10**+3
Boxplot
|
|
+-----+
*-----*
| + |
+-----+
|
|
$ Difference in Tuition
% Difference in Tuition
Rate Increases for all Colleges
Mean: 4.6%
Standard Deviation: 1.07470926
Max: 7.4%
3rd Quartile: 5.2%
Median: 4.1%
1st Quartile: 4.0%
Min: 3.2%
Stem Leaf
7 4
6 00
5 5
5 2
4 56
4 0000011
3 88
3 2
----+----+----+----+
Multiply Stem.Leaf by 10**+3
Boxplot
|
|
+-----+
| + |
*-----*
|
|
Data Files:
college1.dat
college2.dat
college3.dat